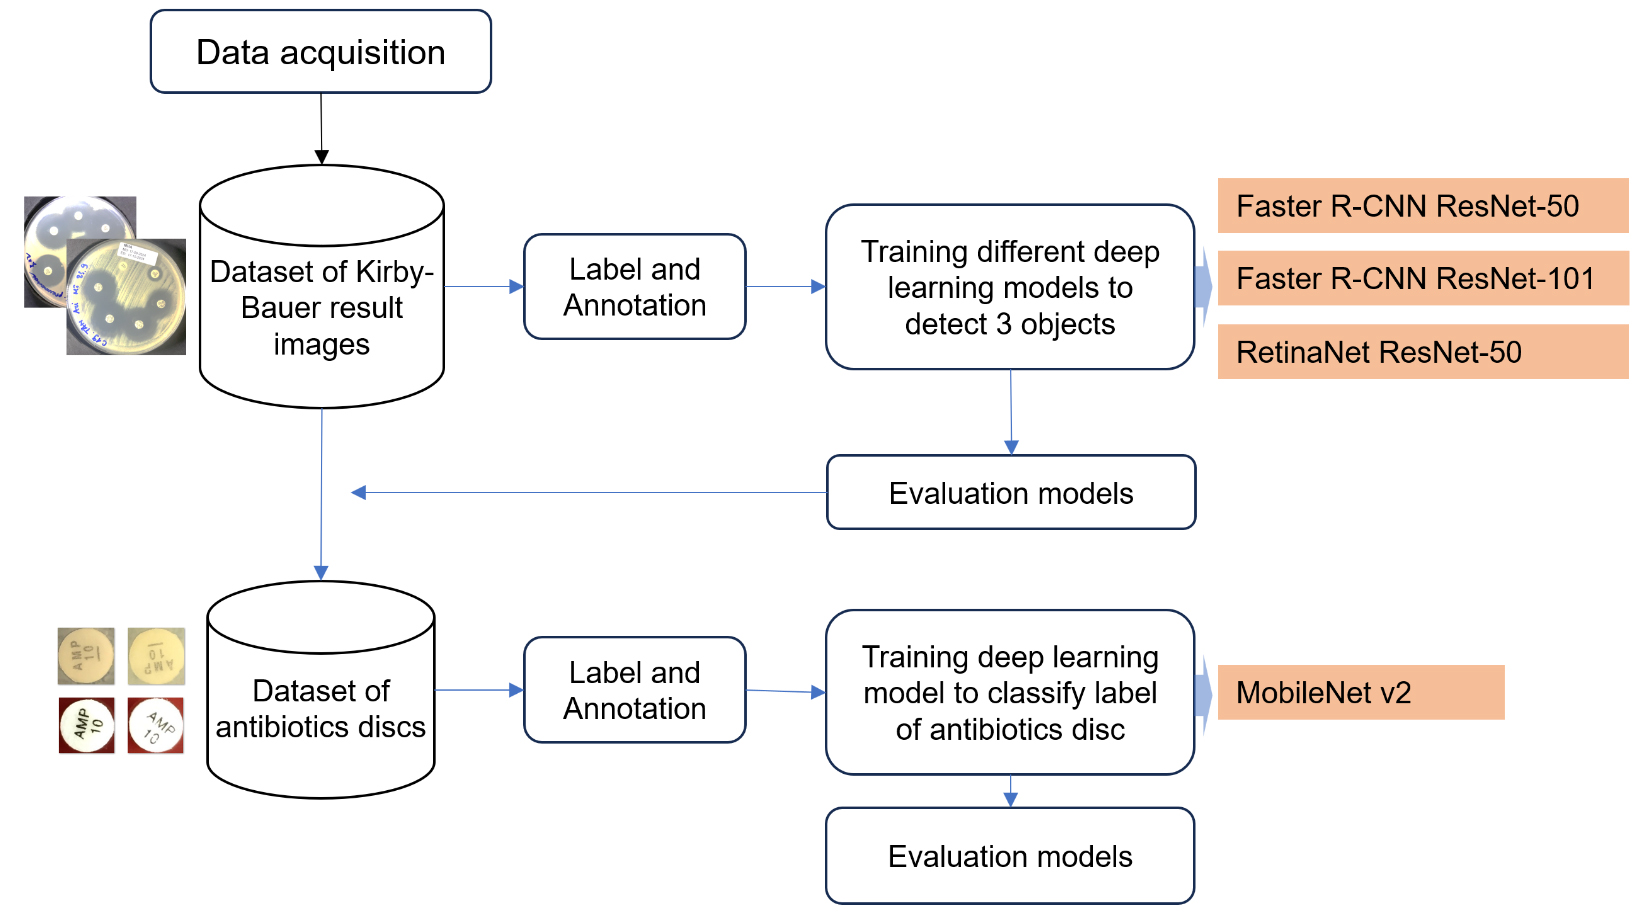
Evaluating Deep Learning Models for Object Detection in Kirby-Bauer Test Result Images
Authors Info & Affiliations
Abstract
Background
The Kirby-Bauer disk diffusion method is a cost-effective and widely used technique for determining antimicrobial susceptibility, suitable for diverse laboratory settings. It involves placing antibiotic disks on a Mueller-Hinton agar plate inoculated with standardized bacteria, leading to inhibition zones after incubation. These zones are manually measured and compared to the Clinical and Laboratory Standards Institute (CLSI) criteria to classify bacteria. However, manual interpretation can introduce variability due to human error, operator skill, and environmental factors, especially in resource-limited settings. Advances in AI and deep learning now enable automation, reducing errors and enhancing consistency in antimicrobial resistance management.
Objective
This study evaluated two deep learning models—Faster R-CNN (ResNet-50 and ResNet-101 backbones) and RetinaNet (ResNet-50 backbone)—for detecting antibiotic disks, inhibition zones, and antibiotic abbreviations on Kirby-Bauer test images. The aim was to automate interpretation and improve clinical decision-making.
Methods
A dataset of 291 Kirby-Bauer test images was annotated for agar plates, antibiotic disks, and inhibition zones. Images were split into training (80%) and evaluation (20%) sets and processed using Azure Machine Learning. Model performance was assessed using mean Average Precision (mAP), precision, recall, and inference time. Automated zone measurements were compared with manual readings using CLSI standards.
Results
Faster R-CNN with ResNet-101 achieved the highest mAP (0.962) and recall (0.972), excelling in detecting small zones. ResNet-50 offered balanced performance with lower computational demands. RetinaNet, though efficient, showed recall variability at higher thresholds. Automated measurements correlated strongly with manual readings, achieving 99% accuracy for susceptibility classification.
Conclusion
Faster R-CNN with ResNet-101 excels in accuracy-critical applications, while RetinaNet offers efficient, real-time alternatives. These findings demonstrate the potential of AI-driven automation to improve antibiotic susceptibility testing in clinical microbiology.
1. INTRODUCTION
The Kirby-Bauer antibiotic sensitivity test method still has many advantages such as its utility in selecting appropriate antibiotics, monitoring antimicrobial effectiveness, and its cost-effectiveness and ease of interpretation by medical personnel [1]. The process involves placing antibiotic-impregnated disks on a Mueller-Hinton agar plate inoculated with a standardized bacterial suspension. Following incubation, clear zones of inhibited bacterial growth, known as inhibition zones, appear around the disks. The diameter of these zones is measured manually and compared to interpretative criteria established by the Clinical and Laboratory Standards Institute (CLSI) to classify bacteria as susceptible, intermediate, or resistant. This is why it remains one of the most widely accepted and practiced methods, especially for laboratories with low and medium turnover. Rapid diagnosis plays an essential role in the treatment of bacterial infections [2]. The AST Kirby-Bauer method is a very time-consuming, multi-step analytical process that relies on the expertise of technicians and has many complex interpretation rules. Therefore, it is necessary to have the support of AI analysis tools to reduce variability due to operator manipulation and interpretation, thus shortening the time to return results to the clinic [3, 4].
Advancements in AI-based image analysis have shown significant promise in automating labor-intensive tasks in microbiology. Several studies have explored deep-learning methods for detecting bacterial growth zones, identifying antibiotic disks, and quantifying inhibition zones in disk diffusion tests. For example, Bollapragada et al. developed a smart system using convolutional neural networks (CNNs) to analyze antimicrobial susceptibility tests, achieving high accuracy in zone measurement and classification [5]. Similarly, Pascucci et al. utilized mobile-based AI applications to support antibiotic resistance monitoring in low-resource settings [6]. However, these studies often lack a direct comparison of object detection models tailored for Kirby-Bauer test images. Our research aims to fill this gap by evaluating the performance of Faster R-CNN and RetinaNet architectures. Additionally, Alonso et al. introduced AntibiogramJ, a tool for analyzing disk diffusion images by applying image preprocessing and edge detection techniques to measure inhibition zones. While effective, this approach relied heavily on image quality and manual threshold tuning, which limited its scalability in diverse conditions [7]. Traore et al. employed deep convolutional neural networks for image recognition tasks, demonstrating the capability of AI to generalize across datasets; however, their study lacked a focus on domain-specific applications like Kirby-Bauer tests [8].
To use computer vision to solve the problem of determining parameters in reading antibiotic susceptibility test results using AI, there are several AI models to identify and classify objects in Kirby-Bauer images. ResNet-50 is a convolutional neural network (CNN) architecture known for its depth of 50 layers and the introduction of residual connections. ResNet-50 is primarily designed for image-classification tasks [8]. RetinaNet is a one-stage object detection model that combines a backbone network (such as ResNet) with a Feature pyramid network (FPN) and focal loss function. It was designed to address the issue of class imbalance in object detection tasks by focusing more on hard-to-detect objects. In this study, the performance of ResNet-50 and RetinaNet in detecting antibiotic discs, inhibition zones, and antibiotic disc abbreviations was evaluated. This allowed us to develop an automated app to analyze the Kirby-Bauer test photo.
Evaluating object detection models is crucial for ensuring their accuracy, reliability, and suitability for real-world applications. Proper evaluation enables objective comparison of models, revealing the best fit for specific tasks while guiding targeted improvements. It also helps to confirm that models can generalize well across diverse datasets, which is essential for robust performance in unpredictable environments. In high-stakes fields like healthcare and autonomous systems, rigorous evaluation upholds industry standards, ensuring that only proven-reliability models are deployed. Thus, comprehensive evaluation strengthens model performance, safety, and applicability, making AI-driven object detection a dependable tool in practical settings [9, 10].
This study aimed to evaluate the performance of deep learning models in the automated detection and analysis of antibiotic susceptibility test results, specifically targeting antibiotic susceptibility plates, inhibition zones, and antibiotic disc abbreviations. By classifying antibiotic disc labels and facilitating automated test result interpretation, the research supports the advancement of the Kirby-Bauer method through AI-driven solutions. The main contributions of this study include the creation of a labeled dataset tailored for Kirby-Bauer test images, a comparative evaluation of Faster R-CNN and RetinaNet models for detecting key parameters, and the development of an automated workflow that integrates object detection and classification, achieving 99% classification accuracy. Furthermore, the study highlights the potential of AI-based methods by comparing their results with manual measurements based on CLSI standards, demonstrating their ability to enhance precision and efficiency in clinical microbiology.
The remainder of this paper is organized as follows: section 2 describes the materials and methods, including dataset preparation, annotation, and the training and evaluation of deep learning models used in the study. Section 3 presents the results and discussion, focusing on the performance comparison of Faster R-CNN and RetinaNet models, including metrics such as precision, recall, and mAP. Section 4 concludes the paper by summarizing the key findings and highlighting their implications for clinical microbiology, along with future directions for research in AI-based analysis of antibiotic susceptibility tests.
2. MATERIALS AND METHODS
2.1. Data Description and Acquisition
In this study, Kirby-Bauer antibiotic susceptibility testing (AST) results on common pathogenic bacteria in the laboratory were utilized. The AST procedures followed standardized Kirby-Bauer protocols, and images were collected to establish a benchmark dataset for evaluation. For each Kirby-Bauer test, a 90mm agar plate was used, with no more than 6 antimicrobial discs placed per plate to prevent overlapping inhibition zones (Fig. 1). 291 Kirby-Bauer test results were imaged, with testing data collected from the Department of Microbiology at the Hue University of Medicine and Pharmacy Hospital between March 2, 2024, and July 20, 2024. All images were captured using a digital camera under adequate lighting, without a flashlight, and with the agar plate positioned centrally to fill the frame and maximize the image quality. The bacterial strains used in this study were selected based on their relevance to antibiotic susceptibility testing using the Kirby-Bauer method, as performed at the Department of Microbiology, Hue University of Medicine and Pharmacy Hospital. These strains represent a diverse group, including cocci, gram-negative, and gram-positive bacilli. A total of 210 bacterial strains were photographed, resulting in 291 images. Some strains were tested on two separate plates with over 10 different antibiotics. In total, the study involved 40 antibiotics, covering 60 distinct commercial labels.
2.2. Data Labeling and Annotation
Each image was annotated to label three specific objects: the plate (agar medium containing bacterial growth zones, antibiotic discs, and inhibition zones), ab_disc (antibiotic disc of fixed diameter, typically 6 mm), and ib_zone (inhibition zone around the antibiotic disc). Labeling was conducted using LabelImg, an open-source annotation tool commonly used to create labeled datasets for deep learning-based image detection [11]. Data labeling was performed in PascalVOC (XML) format, capturing each object’s label and bounding box details of each object for structured annotation [12]. The dataset was partitioned into fixed subsets for training and evaluation, with 80% (232 of 291 images) allocated to training and 20% (59 images) reserved for evaluation (Table 1). This division ensures robust dataset balance, supports model training, and maintains an independent performance evaluation set.
2.3. Utilization of Models in the Interpretation Process
The two models, Faster R-CNN and RetinaNet, are utilized in distinct yet complementary ways to facilitate faster and more reliable clinical decision-making. These models are trained to detect three critical components in Kirby-Bauer test images: antibiotic disks, inhibition zones, and disk abbreviations. Faster R-CNN, a two-stage object detection model, uses a Region Proposal Network (RPN) to generate potential regions of interest, followed by a classification and bounding box regression step to detect and localize these components with high precision [13].
Faster R-CNN is a two-stage detector. First, a Region Proposal Network (RPN) generates candidate regions (anchors) using a backbone feature map F. For each anchor, the RPN predicts:
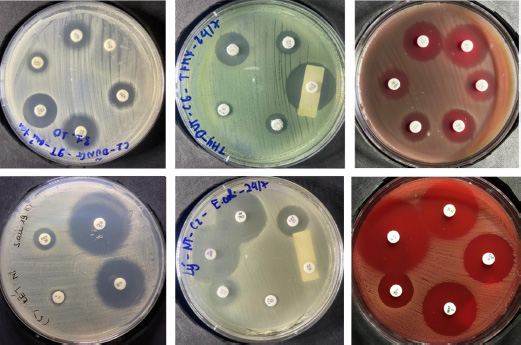
Sample images of Kirby-Bauer test result used in this research.
| Objects | Number of Images | Frame |
|---|---|---|
| Plate | 291 | 291 |
| Antibiotic disc | 291 | 1671 |
| Inhibition zone | 291 | 1630 |
- A binary class score pi (object vs. background) via cross-entropy loss.
- Bounding box offsets
 optimized via smooth L1 loss.
The RPN loss combines classification and regression terms:
 |
where p*i and t*i denote ground-truth labels and boxes.
In the second stage, Region of Interest (RoI) pooling extracts fixed-size features from proposals, followed by classification (Softmax cross-entropy loss for K classes) and box refinement (smooth L1 loss).
RetinaNet, a single-stage model, leverages a Feature pyramid network (FPN) and a focal loss function to focus on hard-to-detect objects such as small inhibition zones with backbone producing multi-scale features {P3 ,..., P7}. Two subnets process each level [14].
- Classification subnet: Outputs class probabilities pi,c using focal loss to mitigate class imbalance:
 |
where α and γ balance easy/hard examples.
- Regression subnet: Predicts box offsets optimized via smooth L1.
The total loss combines both terms:
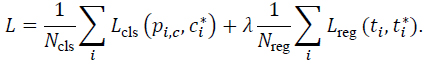 |
The outputs of these models include bounding boxes and class probabilities for each detected object, which are then used to calculate inhibition zone diameters and classify antibiotic susceptibility according to Clinical and Laboratory Standards Institute (CLSI) guidelines.
This automated workflow significantly reduces the reliance on manual measurements, enhancing both the speed and reliability of test result interpretation. By replacing the labor-intensive manual process, these models streamline clinical workflows, enabling timely decision-making for antimicrobial therapy. These models were chosen to compare performance across different detection architectures, providing a comprehensive evaluation of their suitability for analyzing antibiotic susceptibility test images. For labeling the antibiotic paper disc, the MobileNet v2 model was employed to classify the label and calculate the inhibition zone diameter by converting pixel measurements to millimeters (Fig. 2) [15, 16].
2.4. Experimental Configuration
Model training was conducted on the antibiotic susceptibility dataset using the Azure Machine Learning cloud platform. The models' performance metrics, including processing time and memory usage, were evaluated via the MLFlow library, enabling detailed resource utilization tracking throughout the training process. The computational setup employed for these experiments is shown in Table 2.
2.5. Model Training
Model training was conducted using the Azure Automated Machine Learning (Azure AutoML) platform. This widely adopted cloud service provides comprehensive tools for developing, managing, and deploying machine-learning and deep-learning models [17]. Because Azure AutoML requires data in the JSON Lines (JSONL) format, the original annotations in PascalVOC format were converted accordingly to create the training dataset. The dataset was divided into 80% (232 of 291) for training and 20% (59 of 291) for evaluation. Each object detection model was trained at a learning rate of 0.005 over 30 training epochs (Table 3).
Given the hardware constraints of the Azure AutoML environment, the batch size was set to four for YOLOv5 and two for the remaining models to prevent resource limitations from interrupting the training process. This configuration ensures efficient resource use without compromising the model performance.
2.6. Evaluation Methods
Three essential evaluation methods were employed to assess the effectiveness of the model.
Model training performance: The model performance was evaluated using the mean Average Precision (mAP), a standard metric in deep learning model training and evaluation. The mAP score provided a comparative assessment of each model’s detection accuracy.
| Specifications |
Training Environment |
Evaluation Environment |
|---|---|---|
| CPU | 6-core vCPU | Intel Core i5 10500 |
| GPU | NVIDIA Tesla V100 16GB | NVIDIA GTX 1060 3GB |
| RAM | 112 GB | 16GB |
| Disc | 336 GB | 512 GB SSD |
| S | Linux | Windows 11 Pro |
| Programming language | Python 3.8.10 | Python 3.8.18 |
| Framework | PyTorch-ignite 0.4.12 | PyTorch-ignite 0.4.12 |
| Models | Training Epochs | Learning Rate | Batch Size |
|---|---|---|---|
| Faster R-CNN ResNet-50 | 30 | 0.005 | 2 |
| Faster R-CNN ResNet-101 | 30 | 0.005 | 2 |
| RetinaNet ResNet-50 | 30 | 0.005 | 2 |
| Models | Epochs | Training Time | Size of Model |
|---|---|---|---|
| Faster R-CNN ResNet 50 | 30 | 65m 53s | 314 MB |
| Faster R-CNN ResNet 101 | 30 | 93m 00s | 459 MB |
| RetinaNet ResNet 50 | 30 | 43m 44s | 229 MB |
Execution time: Each model was executed on the evaluation dataset to measure processing efficiency, and the average processing time per image was calculated. This metric offers insight into each model's computational speed in practical application scenarios.
Result discrepancy analysis: To quantify the differences between the automated and manual measurements, the diameter of the inhibition zones obtained by the application was compared with those measured manually using a caliper. For each measured zone, the results were categorized as susceptible (S), resistant (R), or intermediate (I), based on Clinical & Laboratory Standards Institute breakpoints (CSLI). Antibiotics without corresponding manual readings were excluded from the analysis.
The comparison between the application-based and manual classifications is categorized as follows:
Very large discrepancy: The manual method classified the sample as susceptible (S), but the application result was resistant (R).
Large discrepancy: The manual method classified the sample as resistant (R), but the application result was susceptible (S).
Small discrepancy: The manual and application results differed, but one of the two classified the sample as intermediate (I).
Similar results: The classifications from both methods were identical.
This multifaceted evaluation comprehensively compares the model accuracy, processing efficiency, and alignment with traditional manual measurements.
3. RESULTS AND DISCUSSIONS
3.1. Evaluating Object Detection Models by Training Time and Model Size
The training time of deep learning models was obtained from Azure AutoML data, which also provided the size of each model. Models loaded from the Azure platform were unpacked, and their sizes were calculated to analyze their resource demands. This information helps assess each model's efficiency, providing insight into training duration and storage requirements, which are critical factors when selecting models for practical applications (Table 4).
Selecting an object detection model requires balancing training efficiency, model size, and real-world performance [18]. In this analysis, three deep learning models—Faster R-CNN ResNet 50, Faster R-CNN ResNet 101, and RetinaNet ResNet 50—were each trained for 30 epochs to evaluate their suitability for various application needs.
Training Efficiency: RetinaNet ResNet 50 shows the shortest training time at 43 minutes, suitable for applications needing rapid deployment with limited computational resources. Faster R-CNN ResNet 50 takes 65 minutes, and the deeper ResNet 101 version requires 93 minutes. Its complexity improves accuracy but increases training demands.
Model Size: RetinaNet ResNet 50 and Faster R-CNN ResNet 50 are compact, at 229 MB and 314 MB, respectively, making them ideal for memory-limited environments. Faster R-CNN ResNet 101 is more prominent, at 459 MB, respectively, and is tailored for high-accuracy tasks in server-rich settings. These sizes indicate trade-offs between portability and accuracy, with Faster R-CNN ResNet 101 best suited for high-performance applications.
Trade-offs and Applications: Each model’s unique balance of size and training demands introduces trade-offs that align with different deployment needs. RetinaNet ResNet-50 excels in quick, low-resource deployments, while Faster R-CNN models offer a balance for accuracy-prioritized applications.
3.2. Evaluation of Object Detection Models Based on Precision, Recall, and mAP
Analyzing the performance of object detection models is essential for understanding how they will behave in real-world applications, particularly in tasks that demand high accuracy and reliability. Our evaluation primarily focuses on the metrics of precision, recall, and mean average precision (mAP), which are essential for assessing the performance of object detection models. Precision quantifies the proportion of true positive detections (TP) among all positive predictions, calculated as Precision = TP/(TP + FP), where FP represents false positives. Recall evaluates the ability to correctly identify true positives out of all actual positives, expressed as Recall = TP/(TP+FN), where FN denotes false negatives. Mean average precision (mAP) is derived as the weighted mean of precision values across varying detection thresholds, with each weight corresponding to the increase in recall from the previous threshold. Together, these metrics provide a comprehensive assessment of the models’ detection accuracy and reliability in diverse scenarios. Each model shows distinct characteristics in identifying and localizing objects, making some more suitable for specific scenarios than others (Table 5) (Fig. 3).
Methodology of the proposed research study.
| Model | Metric | Min | Max | Last |
|---|---|---|---|---|
| Faster R-CNN ResNet 50 | Precision | 0.724 | 0.898 | 0.893 |
| Recall | 0.942 | 0.983 | 0.971 | |
| mAP | 0.891 | 0.962 | 0.959 | |
| Faster R-CNN ResNet 101 | Precision | 0.785 | 0.905 | 0.905 |
| Recall | 0.969 | 0.992 | 0.972 | |
| mAP | 0.915 | 0.974 | 0.962 | |
| RetinaNet ResNet 50 | Precision | 0.894 | 0.673 | 0.835 |
| Recall | 0.625 | 0.976 | 0.960 | |
| mAP | 0.608 | 0.962 | 0.946 |
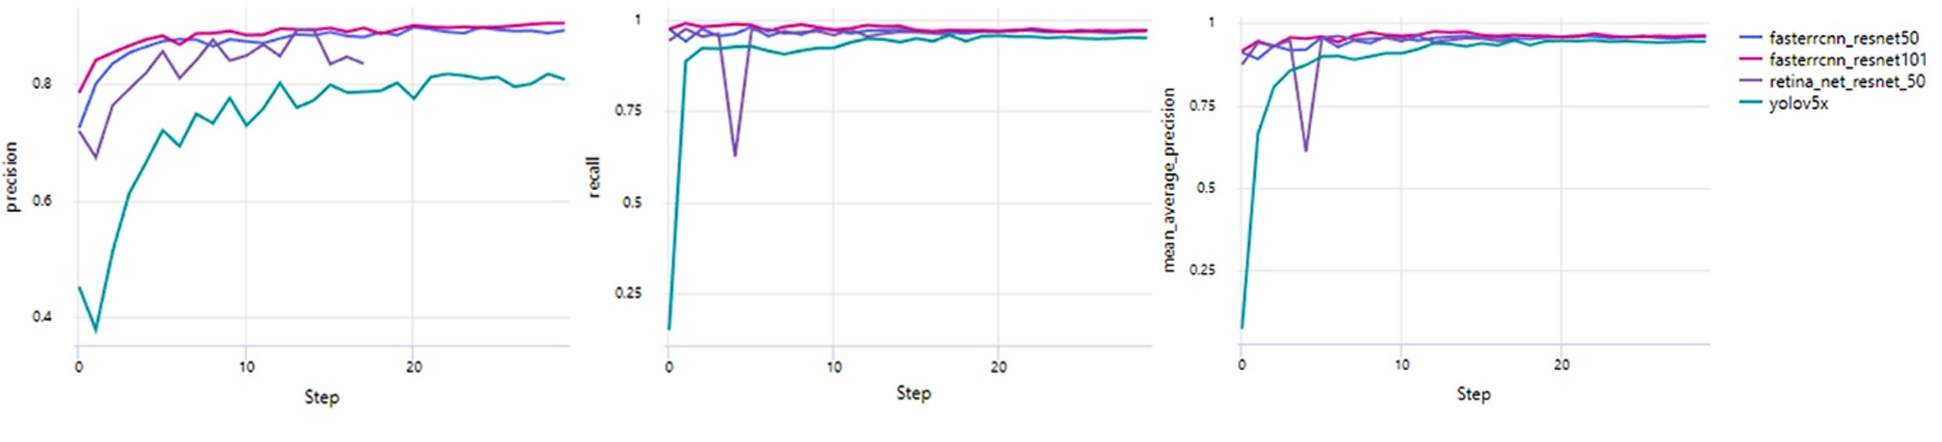
Distribution of Precision, Recall, and mAP.
RetinaNet ResNet 50 has intense initial precision at 0.894, ending with 0.835, and experiences recall variations from 0.625 to a final 0.960. The model’s map also shows some instability, achieving a score of 0.946. These variations reflect the model’s focus on balancing precision and computational efficiency, which is especially valuable for applications where rapid deployment on limited hardware is a priority. The RetinaNet model's unique architecture, which uses a focal loss function to handle class imbalance, may account for some of the observed fluctuations in recall. This sensitivity can impact consistent object detection in complex scenes. However, the model’s overall performance suggests it is well-suited for scenarios prioritizing compact model size and precision over absolute recall stability.
These models reflect a range of trade-offs between precision, recall, and computational demands, each aligning with specific application needs. The Faster R-CNN models are ideal for accuracy-critical tasks, with ResNet 101 offering the best performance. RetinaNet ResNet 50 stands out for its compact size and high precision, fitting well in resource-limited applications that can tolerate slight recall variability. Therefore, the selection of a model depends heavily on the priorities of the application, whether it be accuracy, speed, or computational efficiency, highlighting the importance of understanding each model’s unique strengths and limitations [19].
3.3. Real-world Applicability
In the evaluation of object detection models, including Faster R-CNN ResNet-50, Faster R-CNN ResNet-101, and RetinaNet ResNet-50, precision, recall, and mean average precision (mAP) were assessed for each. While RetinaNet demonstrated strong theoretical performance, reflected in competitive mAP and recall scores, its practical performance within our app revealed significant discrepancies. Specifically, RetinaNet’s precision in real-world scenarios fell short, likely due to differences in training data and deployment conditions that affected its adaptability to our dataset. Designed to detect objects at multiple scales with a feature pyramid network and focal loss, RetinaNet is well-suited for varied detection tasks. However, these strengths did not fully align with the precise detection requirements of our app, leading us to conclude that it may not be ideal for real-world application [20].
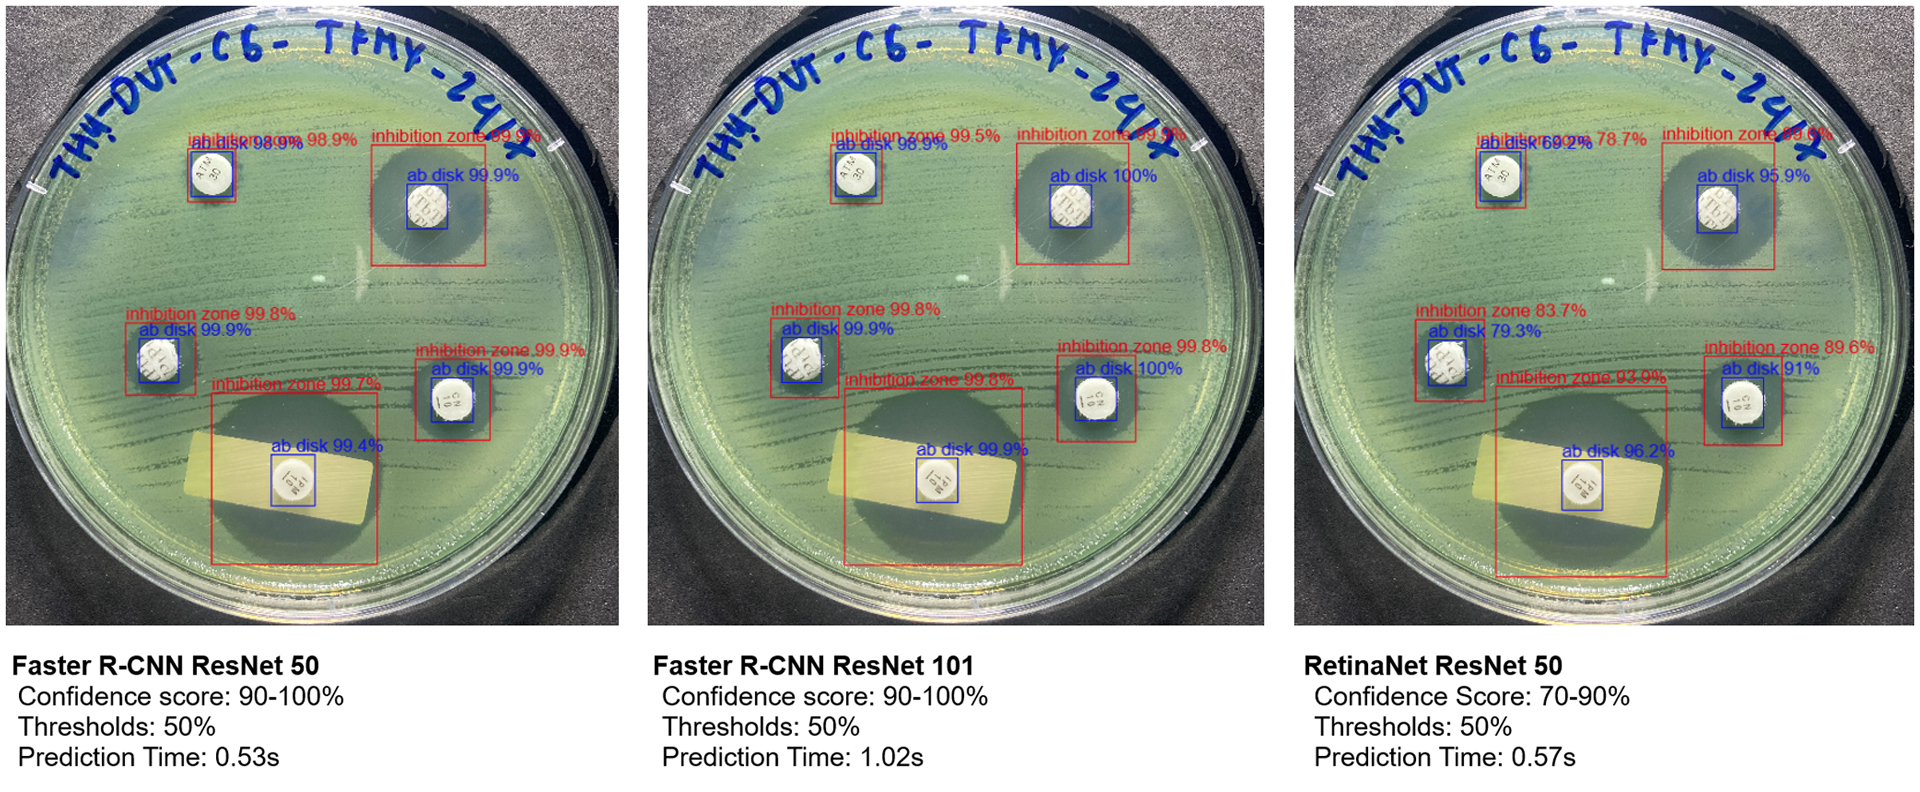
Comparison of confidence scores and prediction times for object detection on Kirby-Bauer test result
In contrast, our application results show that Faster R-CNN ResNet-50 and ResNet-101 models consistently achieved confidence scores of 99-100%, with prediction times averaging around 0.53 seconds for ResNet-50 and 1.02 seconds for ResNet-101, depending on the image. ResNet-50’s faster prediction time makes it particularly suitable for integration within our app. Although RetinaNet also had low prediction times, its confidence scores fluctuated between 70-90%, depending on the objects in the image (Fig. 4), which limited its reliability for our application.
Several studies have applied image-processing algorithms to identify the regions of interest. This study proposes a method for detecting regions of similar size by applying an ROI (Region of Interest) algorithm to isolate the antibiotic agar plate area [7]. The radius of the inhibition zone was calculated by interpolating the pixel-to-millimeter ratio from this region. To pinpoint the location of the antibiotic discs, the image was preprocessed by converting it to grayscale, noise filtering, and applying binary thresholding.
Techniques such as morphological transformations, binarization, or the Hough transform can then be used to detect discs with a standard diameter of 6mm by identifying regions of similar size [16, 21]. This approach offers the advantages of a fast processing speed and relatively accurate detection of paper disc locations. However, its effectiveness is heavily dependent on prior image preprocessing steps such as noise filtering and selecting appropriate parameters for binary thresholding. The accuracy of these parameters is influenced by factors such as lighting conditions, camera quality, and overall image clarity, which in turn affect the precision of subsequent recognition processes. The primary objective of automated analysis is to accurately measure the size of the inhibition zone, with the radial profile calculation method being widely utilized [22, 6]. This method involves calculating the average pixel intensity along the radius extending from the center of the antibiotic disc to a predefined boundary (e.g., 30 mm or up to the nearest neighboring disc). This approach checks for transitions in pixel values from the disc center through the inhibition zone to the bacterial growth zone, typically resulting in a U-shaped intensity profile [6].
In contrast to the approach employed by Muhammad Zubair et al., which targets the denoising of low-dose CT scans to balance radiation safety with diagnostic clarity, our work addresses an entirely different biomedical imaging challenge centered on antibiotic susceptibility testing. Rather than removing noise while preserving anatomical detail, our primary objective is to detect and measure inhibition zones around antibiotic discs on agar plates. This distinction shapes key methodological differences: our study relies on object detection metrics such as precision, recall, and mAP to ensure accurate disc identification and diameter measurement. Additionally, while both studies employ deep learning architectures, the type of data, the underlying tasks, and the real-world usage diverge significantly. In our setup, small circular objects must be reliably recognized under variable imaging conditions, placing a premium on robust detection thresholds and quick inference times for real-time laboratory workflows. Consequently, although both investigations underscore the versatility of deep learning in medical imaging, they cater to distinct application domains, performance requirements, and validation criteria [23, 24].
3.4. Classification of Antibiotic Paper Discs and Measurement of Inhibition Zone Diameters
A deep learning process was developed to interpret antibiotic image results using three main steps, as described in Fig. (5). First, the original image was processed through the deep-learning models (Faster R-CNN and RetinaNet) to locate and isolate frames containing antibiotic paper discs and their surrounding inhibition zones. Next, the image of antibiotic paper discs was cropped from these frames and passed through a classification model, MobileNet v2, to recognize antibiotic disc abbreviations [6]. Finally, using the detected antibiotic disc abbreviations as a reference, the inhibition zone around each disc was identified and the size of this zone was interpolated by calculating the pixel ratio relative to the paper disc. In our experiments, this approach achieved an accuracy of 99% in detecting 97 antibiotic discs in the dataset.
The inhibition zone refers to the clear area surrounding the antibiotic paper disc, where bacterial growth is suppressed. This zone is circular, with its center precisely aligned with that of the disc. Our model accurately detects the inhibition zone, the antibiotic disc, and the coordinates of the disc's center.
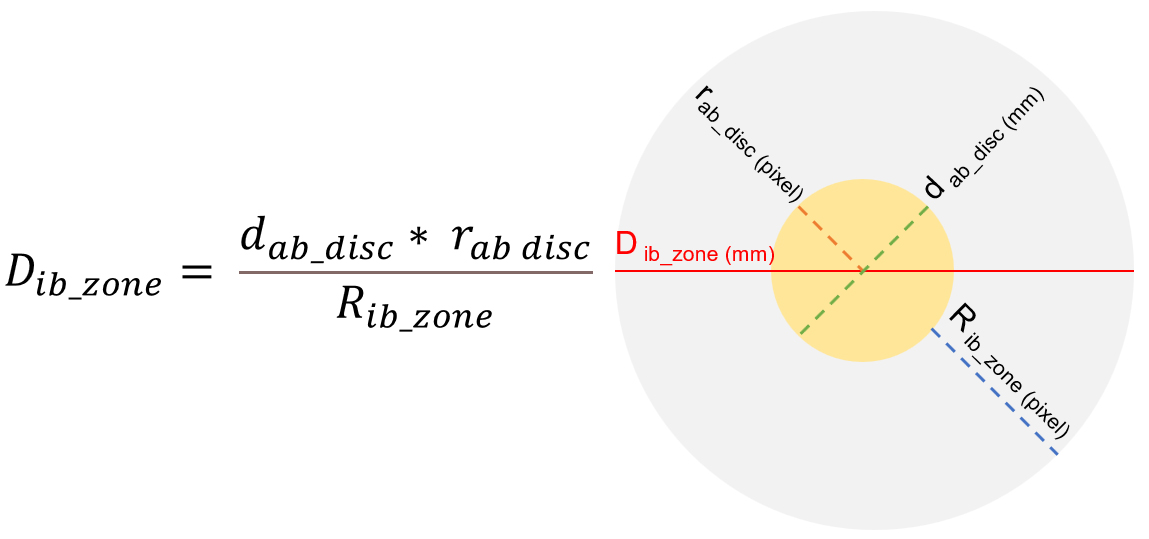
Using these coordinates, the diameter of the inhibition zone can be calculated with the following parameters: rab_disc: radius of the antibiotic paper disc in pixels; dab_disc: diameter of the antibiotic paper disc in millimeters (typically have a diameter of 6 mm for most commercial discs); Rib_zone: radius of the inhibition zone in pixels; Dib_zone: diameter of the inhibition zone in millimeters.
The diameter of the inhibition zone is calculated using the formula in Fig. (6), which converts pixel measurements into millimeters. This enables precise quantification of the inhibition zone size, followed by the classification of the antibiotic, as illustrated in Fig. (7).
3.5. Comparison of Model Performance with Manual Detection of Inhibition Zones
The measured diameters of the inhibition zones were compared against the CLSI standard breakpoints to classify bacterial antibiotic susceptibility into three categories: susceptible (S), intermediate (I), and resistant (R) [25]. The automated classification results were then compared with those obtained from manual measurements to evaluate accuracy and consistency across different antibiotics. To ensure reliable measurements, data collection was based on two predetermined confidence thresholds. Only inhibition zones with detection scores exceeding these thresholds were considered for calculating the zone diameter associated with each antibiotic. This approach minimized false positives and ensured that only accurately detected zones were analyzed. The comparative results for each detection algorithm are summarized in Table 6, highlighting performance metrics, including classification accuracy and alignment with CLSI standards.
The results from the three object detection models Faster R-CNN with ResNet-50, Faster R-CNN with ResNet-101, and RetinaNet with ResNet-50, demonstrate varying performance in detecting inhibition zones at different detection thresholds. At a threshold of 0.0, all models showed high similarity scores, with Faster R-CNN with ResNet-101 consistently achieving the highest similarity (238), followed by Faster R-CNN with ResNet-50 (235) and RetinaNet with ResNet-50 (236). However, increasing the threshold to 0.5 led to a slight decrease in performance, particularly for RetinaNet, where the similarity score dropped to 233, and the “Lack” category increased to 6, indicating more missed detections. This suggests that RetinaNet is more sensitive to the threshold adjustment, leading to a higher number of missed inhibition zones when the confidence requirement is increased.
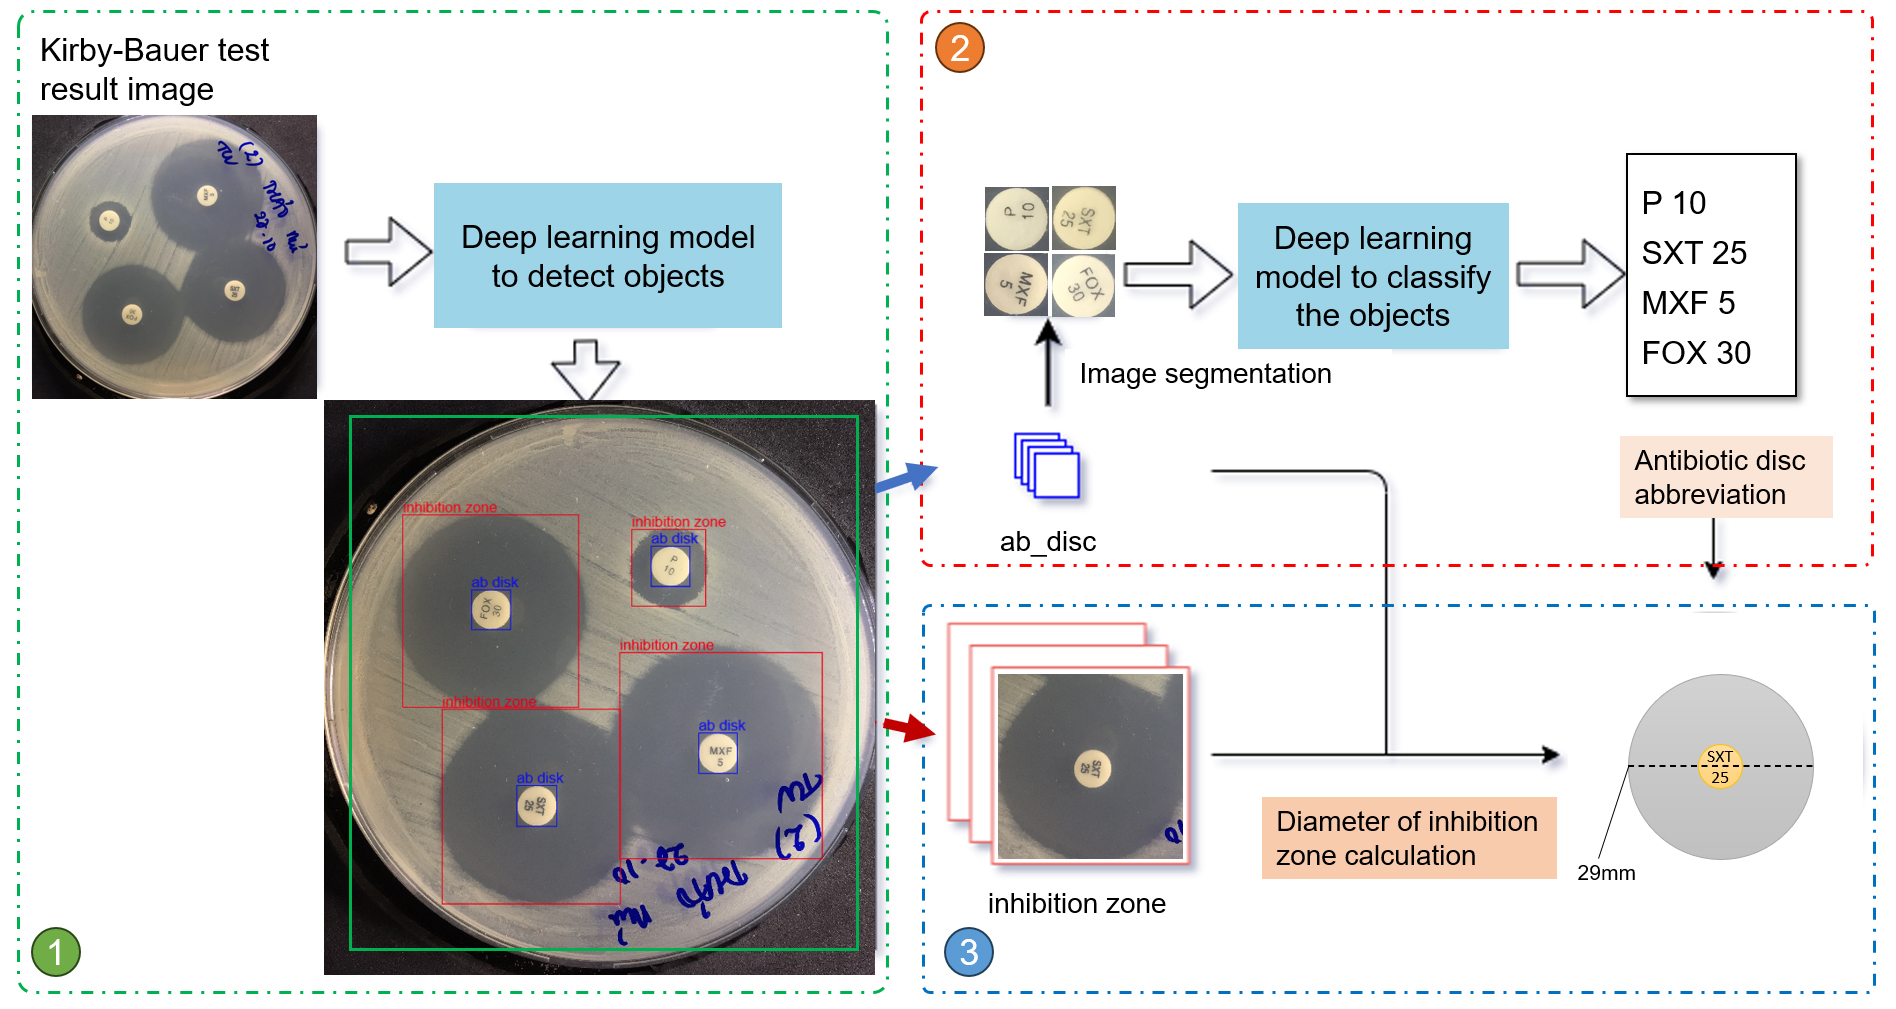
Workflow to detect 3 parameters: inhibition zone, antibiotic paper disc, and diameter of inhibition zone.
The algorithm automatically converts pixel measurements into millimeter diameters for the inhibition zones in Kirby-Bauer test results.
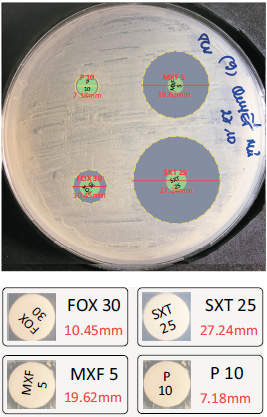
Classification of antibiotic paper discs using MobileNetv2 and calculation of inhibition zone diameters in millimeter.
|
Architectural Models |
Faster R-CNN ResNet 50 | Faster R-CNN ResNet 101 | RetinaNet ResNet 50 | |||
|---|---|---|---|---|---|---|
| Threshold | 0.0 | 0.5 | 0.0 | 0.5 | 0.0 | 0.5 |
| Similarity | 235 | 234 | 238 | 238 | 236 | 233 |
| Small | 11 | 11 | 9 | 9 | 9 | 7 |
| Large | 7 | 7 | 5 | 5 | 5 | 6 |
| Very Large | 5 | 5 | 6 | 6 | 6 | 6 |
| Lack | 0 | 1 | 0 | 0 | 0 | 6 |
In terms of detection of inhibition zone sizes, Faster R-CNN with ResNet-101 performed notably better for smaller zones, with fewer instances classified as “Small” (9 compared to 11 for ResNet-50), likely due to its deeper architecture and better feature extraction capabilities. The detection of “Large” and “Very Large” zones was relatively consistent across all models, indicating that these larger zones are easier to identify regardless of the model or threshold setting.
These findings underscore the trade-off between accuracy and computational efficiency. While Faster R-CNN with ResNet-101 provided the most reliable and consistent results across different thresholds, RetinaNet proved to be a faster model, though with a tendency to miss detections at higher thresholds. Therefore, for applications requiring high detection accuracy, especially for smaller inhibition zones, Faster R-CNN with ResNet-101 is the most suitable model. On the other hand, RetinaNet may offer a more computationally efficient solution, albeit with some compromises in detection reliability, particularly at higher thresholds. These results highlight the importance of careful threshold selection and model tuning to achieve an optimal balance between detection performance and computational efficiency.
CONCLUSION
The application of deep learning models, particularly Faster R-CNN and RetinaNet, has proven to be highly effective in automating the analysis of Kirby-Bauer test images. This study demonstrated that Faster R-CNN with ResNet-101 provides superior accuracy and consistency in detecting antibiotic disks, inhibition zones, and disk abbreviations, making it an optimal choice for high-stakes clinical environments where precision is critical. In contrast, RetinaNet offers a practical trade-off between speed and precision, making it well-suited for settings with limited computational resources or where rapid results are a priority. These findings highlight the adaptability of these models to different resource settings and use cases, enabling their integration into diverse microbiological workflows.
By replacing labor-intensive manual processes, these automated models can significantly enhance the efficiency, reproducibility, and reliability of antibiotic susceptibility testing. Faster turnaround times and reduced human error directly contribute to improved clinical decision-making, ultimately benefiting patient care by enabling more timely and accurate antimicrobial treatment decisions. Additionally, the ability to standardize testing procedures through automation supports global efforts in antimicrobial stewardship, combating the growing threat of antibiotic resistance.
Despite these promising results, the study acknowledges certain limitations, such as the lack of diversity in the dataset, which may affect the generalizability of the models across different geographical and clinical settings. Future research should prioritize expanding the dataset to include a broader range of bacterial strains and testing conditions, as well as evaluating the models in real-world clinical environments to validate their performance further. Moreover, integrating these AI-driven tools with laboratory information management systems (LIMS) could streamline their deployment and enhance data-sharing capabilities.
In conclusion, this study underscores the potential of deep learning models in transforming traditional microbiological workflows. The demonstrated accuracy, speed, and adaptability of Faster R-CNN and RetinaNet provide a solid foundation for integrating AI-based solutions into clinical laboratories, paving the way for more effective and efficient antibiotic susceptibility testing. With continued research and development, these technologies have the potential to revolutionize clinical microbiology and significantly improve global health outcomes.
AUTHORS’ CONTRIBUTIONS
The authors confirm their contribution to the paper as follows: draft manuscript: H.B.N.; Data Curation: T.L.P.; Validation: T.K.L.N. All authors reviewed the results and approved the final version of the manuscript.
LIST OF ABBREVIATIONS
| AST | = Antibiotic Susceptibility Test |
| CLSI | = Clinical and Laboratory Standards Institute |
| CNN | = Convolutional Neural Network |
| JSON | = JavaScript Object Notation |
| XML | = Extensible Markup Language |
AVAILABILITY OF DATA AND MATERIALS
The data supporting the findings of this article has been deposited in the Zenodo repository and is accessible at: https://zenodo.org/records/15130387.
ACKNOWLEDGEMENTS
We sincerely thank the Department of Microbiology, Hue University of Medicine and Pharmacy Hospital for their invaluable support in providing antibiotic susceptibility test (AST) samples and assisting with the manual reading and interpretation of results.