A Mathematical Model for Predicting Nearest Neighbor in Diabetes Diagnosis
Abstract
Introduction
Diabetes has a significant impact on a substantial proportion of the global population. It is widely regarded as the most prevalent global ailment, as it impacts individuals of all ages and socioeconomic backgrounds. The integration of artificial intelligence into the field of medicine has facilitated the deduction of numerous diseases and has also aided in the anticipation and timely identification of various ailments, such as diabetes.
Methods
This research presents a novel classification algorithm that relies solely on mathematical computations to accurately predict the health status of patients, distinguishing between those with diabetes and those without. By doing these computations on a set of patient attributes, such as BMI, pregnancies, insulin level, etc., which are associated with diabetes, we can derive values that are utilized to forecast the patient's condition by comparing them with the closest categorized values.
Results
The results of the proposed study demonstrate that our suggested algorithm PNN surpasses existing machine learning algorithms, including Decision Tree, Naïve Bayes, AdaBoost, and KNN, in terms of accuracy.
Discussion
The highest accuracy obtained by our proposed algorithm PNN is 83%, which is achieved when k= 17. That is higher than all the algorithms tested (AdaBoost 72%, Decision Tree 68%, Naïve Bayes 66%, KNN 78%)
1. INTRODUCTION
Artificial intelligence (AI) has advanced to the extent where it has become integrated into our everyday existence. Artificial intelligence has been implemented in various aspects of our everyday tasks. The incorporation of artificial intelligence in the field of medicine has brought about a significant transformation by providing advanced capabilities for early prediction and diagnosis of numerous diseases. An example of AI's utilization in the field of medicine involves the forecasting of prediabetes or the timely identification of diabetes. Diabetes is a condition caused by a malfunction in the manufacture of insulin in the pancreas, leading to increased levels of glucose in the bloodstream. Diabetes is a multifaceted disease that can arise from various sources, including immune system dysfunction, genetic mutations, or lifestyle choices. Occasionally, women may acquire diabetes during pregnancy due to hormonal fluctuations or the side effects of certain drugs.
Typically, engaging in consistent physical exercise and maintaining a well-proportioned, controlled body weight are the fundamental elements for preventing and managing diabetes. According to the American Diabetes Association, in 2019, diabetes affected 11.3% of the population in the United States of America. This translates to 37.3 million adults, out of which 28.7 million had been officially diagnosed, while 8.5 million remained unaware of their condition [1]. In the year 2019, a total of 96 million individuals in the United States who were 18 years old or older were identified as having prediabetes. Additionally, it was anticipated that 0.35% of the population under the age of 20 had been diagnosed with diabetes. Diabetes is ranked as the seventh leading cause of death in the United States [1]. A study conducted in the Middle East and North Africa from 1990-2019 examined the prevalence of type 2 diabetes (T2D). The study found that in 2019, approximately 463 million individuals between the ages of 20 and 79 were living with diabetes worldwide. This accounted for 9.3% of the global adult population, according to estimates from the International Diabetes Federation. The projected percentage is anticipated to rise to 10.2% by 2030 and further to 10.9% by 2045. The most significant growth is expected to occur in low- and middle-income nations [2].
The study conducted in 2022 includes an analysis of 21 nations, namely Afghanistan, Algeria, Bahrain, Egypt, the Islamic Republic of Iran, Iraq, Jordan, Kuwait, Lebanon, Libya, Morocco, Palestine, Oman, Qatar, Saudi Arabia, and others [2]. According to the findings, Qatar and Bahrain had the greatest prevalence of T2D in 1990, as measured by the age-standardized rate (ASR). Bahrain is expected to maintain its position as the country with the highest incidence rate in 2019. In 1990, Egypt had the lowest prevalence rate, but by 2019, Yemen had surpassed Egypt and had the lowest prevalence rate. Overall, with the exception of Yemen and Turkey, the prevalence of T2D was greater than the worldwide norm in all the countries examined in 2019. In 1990, Qatar and Bahrain had the highest age-standardized death rates (ASR) for deaths related to Type 2 Diabetes (T2D). In 1990, Tunisia had the most favorable mortality rate compared to other countries. In 2019, Qatar and Bahrain maintained the highest death rates, while Yemen had the lowest death rate. This study considered various risk factors, including metabolic risk factors, Body Mass Index (BMI), air pollution, and behavioral risk factors such as smoking, poor physical activity, and dietary risks [2].
The health care sector possesses extensive databases that can be utilized for extracting knowledge and uncovering latent patterns that aid in enhancing prediction and diagnosis within this field. Artificial intelligence technologies and applications also enable the ongoing monitoring of blood glucose levels. Implementing real-time monitoring can improve the accuracy of diabetes management and aid in the prevention of acute complications.
This research presents a Prediction Nearest Neighbors Algorithm (PNNA) that utilizes basic mathematical calculations to forecast the onset of diabetes at an early stage. The algorithm is utilized on actual patient data, which includes several risk factors such as the number of pregnancies, glucose rate, Body Mass Indicator (BMI), and age. Its purpose is to forecast the likelihood of acquiring diabetes based on these parameters. The foundation of our work lies in the Hussein Search Algorithm that involves calculating the average of all the data points (including all features) and then dividing each value by the corresponding average, and then determining the distances between each new individual data point and the others [3]. Hussein Search Algorithm, has time complexity O (1) for searching about an item in a list. This allows us to identify the k nearest values to a given data point [3]. The prediction is made by considering the majority of the k nearest neighbors for each value. The value of k ranges from 1 to 17 and is an integer. Our findings demonstrate that our approach outperforms various machine learning algorithms (Ada-boost, Decision Tree, Naïve Bayes, and KNN) when applied to the identical dataset, under identical conditions, and in the same environment.
The main idea of our proposed algorithm is to use the average of averages that increases accuracy in the prediction of various variables such as age, obesity, and sedentary lifestyle, inherited predisposition to diabetes, poor dietary choices, and high blood pressure might contribute to the development of diabetes. Individuals with diabetes are susceptible to developing conditions such as heart disease, renal disease, eye complications, and nerve damage. Data analysis of bugs facilitates the identification of valuable insights and concealed patterns within the data, aiding in the process of making informed decisions. Machine learning algorithms can be utilized to perform predictive analysis. Machine learning algorithms possess the capability to assimilate knowledge from previous encounters. In another study various machine learning methods (KNN, DTC, Gaussian NB, LDA, Svc, linear SVC, Ada Boost, random forest classifier, additional tree classifier, and perceptual bagging) are employed to analyze and forecast data via pipelines [4]. The k-means clustering technique is utilized to gather and group data, with the purpose of classifying whether each patient is diabetic or not. The utilized variables were glucose and age. [4], indicate that logistic regression and additional tree classifiers achieve an accuracy of 76% on the PIMA dataset. However, it is worth noting that the same technique attains an accuracy of approximately 96% on the dataset mentioned in the study, however, the source of this data is not specified. The AdaBoost classifier achieves a maximum accuracy rate of 98.8% when used for pipelining results. On the other hand, linear discriminant analysis yields the lowest accuracy rate of approximately 95%. However, by implementing pipelining, the performance of logistic regression is enhanced to 97.2%.
Diabetes is a chronic condition that lacks a definitive remedy; timely identification is crucial in order to avert the progression of the disease into unmanageable phases. The performance of several machine learning methods in the early prediction of the condition of diabetic patients is evaluated using the PIMA Indian Diabetes (PID) datasets [5]. The dataset consists of 768 patients and includes nine attributes: pregnancy, BMI, insulin level, age, blood pressure, skin thickness, glucose, diabetes pedigree function, and class. Data undergoes various stages, including preprocessing or data cleaning (eliminating missing values), feature selection, normalization, and ultimately training and testing. The results demonstrate the varying accuracy performance of the analyzed algorithms, ranging from 73.14% in the decision tree to 79.42% in KNN. The precision ranges from 73.5% in the decision tree method to 80.4% in KNN. Nevertheless, the neural network algorithm with two hidden layers can achieve an accuracy of 88.6%.
The paper showed a prediction model called OPT-KNN (Optimal K-nearest neighbor) [6]. This model aims to determine the optimal number of neighbors to provide improved prediction results based on the habitual features of patients. A comprehensive dataset is compiled on numerous diabetes patients from multiple hospitals, encompassing diverse qualities or risk factors such as age, diet, hypertension, vision impairments, hereditary variables, and more. The best value of “ok” is determined by computing the mean absolute value, which is the average difference between projected values and genuine values, in order to achieve a lower error rate. The results indicate that the optimal value for k is 3. The precision of KNN and ideal KNN is compared based on these results. The results indicate that the accuracy of the k-nearest neighbors (KNN) algorithm is 70%, whilst the optimal KNN algorithm achieves a precision of up to 75%. Next, optimal k-nearest neighbors (KNN) is compared with other methods like logistic regression, AdaBoost, naive Bayes, decision trees, and support vector machines (SVM). The findings indicate that opt-KNN outperforms the other algorithms in terms of precision. However, the precision values for all the techniques, including the proposed approach, remain below 80%.
According to the International Diabetes Federation, the current global estimate for the number of individuals with diabetes is 463 million, and this figure is projected to increase to 578 million by 2030 [7]. A classification model is proposed in that utilizes the k-nearest neighbors (KNN) algorithm to accurately categorize patients into either the diabetic or non-diabetics categories [8]. The performance of the k-nearest neighbors (KNN) algorithm is evaluated using a PIMA dataset. Different values of k are tested to determine the optimal performance in terms of accuracy and precision. The performance metrics (accuracy, precision, recall, and F1) are evaluated for k = 33, 40, and 45, where k represents the number of neighbors for a certain dataset. The optimal performance is attained when k is set to either 33 or 40, resulting in an accuracy of 87.01% and a precision of 94.44%. The study described in reference [8] is contrasted with other studies in a similar environment, but utilizing various software tools, such as Weka and Matlab. The findings indicate that the accuracy of the k-nearest neighbors (KNN) algorithm, with k set to 3, is 85.80%. This accuracy was obtained using Weka tools [9]. The accuracy of the k-nearest neighbors (KNN) algorithm is 67% when k is set to 5, as determined using Matlab [10]. The KNN algorithm achieved a performance of 75.97% in [11], while the SVM algorithm achieved a performance of 90.233%. On the other hand, the decision tree algorithm yielded an accuracy of 75.32%.
The study examines the accuracy of several KNN algorithms in predicting whether a patient is diabetic or not [12]. This is done by utilizing personal datasets such as the HABA1C test (Hemoglobin A1C), the fasting test, and the FPG (Fasting Plasma Glucose) random test. The diagnosis of diabetes relies on the assessment of Post Prandial glucose (PG) and plasma levels. The training dataset consists of 4900 input samples, whereas the testing dataset comprises 100 input samples. The performance of various KNN algorithms was studied using Matlab. Specifically, the algorithms evaluated were fine knn with k = 1, medium KNN with k = 10, coarse knn with k = 100, cosine KNN with k = 10, cubic knn with k = 10, and weighted KNN with k = 10. The results indicate that fine knn and weighted KNN exhibit the highest performance, with accuracy rates of 99.9% and 99.8% respectively. They are followed by medium KNN and cubic KNN with accuracy rates of 98.4% and 98.2% respectively. Coarse KNN achieves an accuracy rate of 74.3% and cosine KNN achieves an accuracy rate of 85.6%. The prevalence of diabetes has significantly risen due to global changes in dietary trends. According to a projection, the global diabetic population is expected to reach 537 million by the year 2022 [13]. By 2030, diabetes is projected to rank as the seventh most common cause of mortality globally, as stated by the International Diabetes Federation. There is a strong correlation between BMI and the occurrence of diabetes.
Another study examined five machine learning models using data obtained from the National Health and Nutrition Examination Survey [14]. The dataset has 124,821 entries documenting individuals residing in the United States from 1999 to 2020, before the onset of the epidemic. The dataset comprised 18 parameters that are important to diabetes and one outcome variable. The elements can be categorized into three groups: one pertaining to demographic information, the second pertaining to nutritional information, and the third pertaining to examination data such as BMI, BPXOSY (systolic), and BPXODI (diastolic). The XGBOOST method the CAT Boost algorithm the support vector machine algorithm the random forest algorithm and the logistic location algorithm were utilized [15-19]. The findings indicate that CAT boost outperforms other models in terms of accuracy, achieving a score of 82.1% for both balanced and unbalanced data. In comparison, random forest achieves an accuracy of 78.4%, SVM 67%, XGB 70.8%, and logistic regression 68.9%, making them the least accurate models. In order to investigate the impact of the 18 features on the performance of a machine learning algorithm, we employed the SHAP Model (Shapley Additive Explanation). The results indicate that sleep time, energy, and age are the most significant factors in predicting diabetes, while drinking status, smoking, and sex are the least significant factors. Several variables such as age, lack of physical activity, a sedentary lifestyle, family history, depression, and stress, have a role in the development of diabetes. Diabetes itself can lead to various health conditions like kidney disease, heart disease, nerve damage, and eye problems.
A survey published in [20] that discusses the utilization of machine learning algorithms for the early detection of diabetes. The findings indicate that support vector machines (SVM), k-nearest neighbors (KNN), and random forests, RF exhibit the highest accuracy in predicting early diabetes. The PIMA Indian Diabetes dataset (PID) was utilized to predict early-stage diabetes using various machine learning techniques, including gradient boosting, Naïve Bayes, and logistic regression [21]. The results indicate that gradient boosting achieves superior accuracy (86%), while naïve Bayes exhibits lesser accuracy (77%).
In the study [22], researchers utilized a dataset consisting of 520*16-bit data points from the UCI repository. They examined the performance of various machine learning algorithms, including KNN, SVM, logistic regression, naïve Bayes, decision trees, random forests, and multi-layer perception. The objective was to identify the most optimal machine-learning algorithm. The findings indicate that random forest algorithms and multi-layer perception exhibit superior performance with an accuracy rate of 98%, while Naïve Bayes demonstrates poorer performance with an accuracy rate of 91%. On the other hand, SVM and decision trees yield comparable performance with an accuracy rate of 94%. Logistic regression achieves a 93% accuracy rate. The performance of the Naïve Bayes algorithm, SVM, and light GBM algorithm (Light Gradient Boosting Machine) was evaluated using the same data in [22, 23]. The accuracy achieved by these algorithms was 88.46%. The PID (PIMA dataset for Indian diabetes) is utilized together with the identical data employed to evaluate the efficacy of the subsequent algorithms the performance of DT, SVM, and NBC (Naïve Bayes Classifier) was evaluated to determine the most accurate predictor of early-stage diabetes [21, 24]. The NBC algorithm achieved the highest performance, with a success rate of 74%. SVM achieved a success rate of 63%, and DT achieved a success rate of 72%.
The data found by Sadhu and Jadli, and Khanam and Foo can also be found in the study by Pal [24, 21, 25] can also be found in [25]. The researchers examined the performance of neural network techniques (NN) and several algorithms such as DT, KNN, RFC, NBC, SVM, and LR using the WEKA tool. By integrating the logistic regression (LR) and support vector machine (SVM) techniques, a neural network with two hidden layers is formed, which achieves an accuracy rate of 88.5%. However, when used individually, LR achieves an accuracy rate of 78.85%, NBC has an accuracy rate of 78.28%, and RF achieves an accuracy rate of 77.34%. The study conducted by Pal utilized the J48 decision tree technique, as well as random forest and neural networks, to forecast the occurrence of diabetes [26]. The dataset used for this analysis was obtained from Luzhou China Hospital. The dataset has a dimension of 68994*14 and comprises both individuals without any health conditions and individuals diagnosed with diabetes. The algorithms tested on the Pima Indian dataset achieved the highest accuracy rates while evaluating all the features in the dataset (80.84%, 76.04%). The J48 algorithm achieved an accuracy of 78.53% on the Luzhou dataset and 72.75% on the Pima dataset. In comparison, the neural network model achieved an accuracy of 78.41% on the Luzhou dataset and 76.67% on the Pima Indian dataset. Subsequently, the algorithms undergo testing on an identical data set utilizing blood glucose. The results indicate that the random forest algorithm (RF) has the highest performance on both datasets, with accuracy rates of 74.97% and 67.28%, respectively. Neural networks achieved the lowest accuracy of 75.72% on the Luzhou dataset, whereas J48 had the lowest accuracy of 68.95% on the Pima Indian dataset. Based on past research, it can be inferred that the algorithm's ability to predict a patient's condition accurately is contingent upon the dataset utilized. Table 1 presents a comparison of some of the previous works mentioned above in terms of accuracy and the algorithms used.
| Algorithms | ||||||||
|---|---|---|---|---|---|---|---|---|
| [4] | [5] | [8] | [12] | [14] | [22] | [24] | [26] | |
| Gradient boosting | - | - | - | - | - | 86% | - | - |
| KNN | - | 79.42% | WEKA 85.80% |
FINE KNN 99.9% | - | - | - | - |
| Decision tree | - | - | - | - | - | - | - | - |
| Naïve bayes | - | 73.14% | 75.32/% | - | - | 94% | 72% | J48/ 78.53% |
| Ada boost | Pipelining 98.8% |
- | - | - | - | - | - | - |
| Random forest | - | - | - | - | 78.4% | 98% | 77.34% | 74.97% |
| Extra tree classifier | 76% | - | - | - | - | - | - | - |
| Logistic regression | 76% | 97.2% | - | - | 68.9% | 93% | 78.85% | - |
| Neural networks | - | 88.6% | - | - | - | - | 88.5% | 78.41% |
| SVM | - | - | 90.23% | - | 67% | 94% | 63% | - |
| Cat Boost | - | - | - | - | 82.1% | - | - | - |
| XGB | - | - | - | - | 70.8% | - | - | - |
This paper introduces a novel prediction and classification algorithm named PNN, which operates similarly to KNN and incorporates the primary technique employed in the Hussein Search Algorithm [3], namely, computing the mean of all the data. The approach was developed using the Python programming language and applied to the PIMA Indians dataset. Subsequently, its performance is evaluated in comparison to other algorithms such as Naïve Bayes, Decision Tree, and AdaBoost [27]. Our findings demonstrate that our method surpasses all the examined algorithms in terms of accuracy when applied to the same dataset [28]. Table 1 provides a concise overview of the accuracy achieved in the connected studies [29, 30-31]. The rest of the paper is organized as follows: In Section 2, we will present our proposed algorithm, which encompasses the simulation environment. Section 3 includes results and results analysis, finally discussion, conclusion, and future work.
2. METHODS AND MATERIALS
This section will outline our proposed algorithm, PNN (Prediction Nearest Neighbors), which is derived from the Hussein Search Algorithm [3] and employs the same computational techniques. The work in our algorithm, as any machine learning algorithm, is based on three crucial computations applied to categorized data to forecast uncategorized data.
2.1. Algorithm description
Our proposed algorithm, PNN, works in phases: a preprocessing phase in which data is prepared and encoded, then the training phase and testing phase.
2.1.1. Phase 1
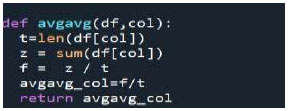
The preprocessing phase involves the initial preparation of the data by computing the average of average of all the features. For instance, when the data consists of n columns (attributes), we compute the average of the average for each attribute. The average of the averages or weighted averages, in data where all the items have the same weight and are equal to 1, is calculated given the following summation:
Weighted average

This approach helps minimize errors and improve the accuracy of predictions. After dividing all the items by the average of averages, the Euclidean Distance is used to determine the proximity between unclassified data and classified data to identify the nearest neighbors. The final computation is the majority of the class, which predicts the class of unclassified data by considering the class of the majority of its nearest neighbors, (Fig. 1).
Subsequently, the data is split into two parts: training and testing, to prepare it for subsequent stages.
2.1.2. Phase 2
Training phase, during the training phase, the training data is divided by the average of each column. Each column is divided by its corresponding average of average.
2.1.3. Phase 3
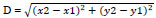
Testing phase, during the testing phase, we test unclassified data using trained data. To accomplish this, the data is initially divided by the average, and then each resulting value is rounded up to the next whole number. Next, the Euclidean distance between each unclassified and all the training data is computed to get the closest value using the following equation (eq 1):
Average of average function.
 |
(1) |
Where x2 represents the corresponding attribute value in the testing data, and x1 represents the attribute value in the training dataset, and so forth for all the attributes. Next, these distances are arranged to identify the closest values to the corresponding testing value. For class prediction, we consider the k nearest neighbors and determine the majority class among these neighbors. This majority class is then assigned as the anticipated class for the unclassified data.
For instance, in a scenario where we have two classes, positive and negative, if the majority of the k neighbors are negative, the forecast will be negative.
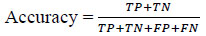
To determine if our model converged, we assessed its efficiency by using machine learning performance metrics, including accuracy (eq 2), precision (eq 3), recall, F1 score, and error rate.
Accuracy is a metric used to evaluate the algorithm's performance. It is calculated by dividing the number of correct predictions by the total number of data points evaluated.
 |
(2) |
TP stands for true positive and refers to the number of cases that are correctly predicted as positive, and whose actual values are indeed positive. TN, or true negative, refers to the total number of cases that are correctly predicted as negative and have actual negative values. FP stands for false positive and refers to the number of instances that are incorrectly predicted as positive when their actual values are negative. FN stands for false negative and refers to the number of cases that are projected to be negative but are really positive. A higher accuracy ratio indicates a stronger prediction and better algorithm performance.
Precision measures the proportion of accurately anticipated positive instances out of the total number of positive examples.
 |
(3) |
Our algorithm is implemented using Python programming language. It uses python libraries to analyze the PIMA Indians dataset, which is obtained from the Kaggle website [29], to predict the early onset of diabetes. The data size is 5792 bits. Initially, the data is purified by removing any empty values. Subsequently, the mean of all the data is computed using the function called “avgavg” (Fig. 1).
Subsequently, the data is partitioned into two segments, namely training and testing, using varying ratios such as 40:60 or 70:30. The division of the training and testing data is based on the respective averages obtained before using the train test data function (Fig. 2).
Then, on the testing data, the Euclidean distance between all testing records and the training records is applied using the function math.dist from the math library in python (Fig. 3).
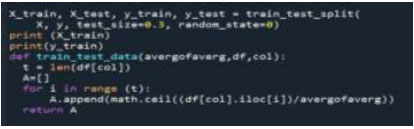
Training and testing function.
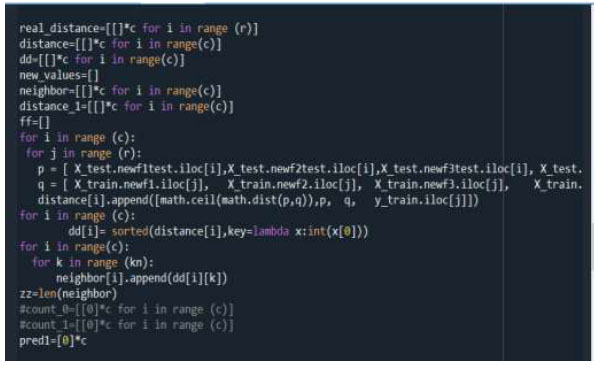
Distance calculation function.
In order to accurately forecast the class of tested data, several values of k are utilized to identify the nearest neighbors. The class of the majority of these nearest neighbors is then determined to achieve the highest level of accuracy. Our findings indicate that the highest level of accuracy is achieved when k is set to 17, where the testing is repeated 10 times and is considered the average.
3. RESULTS
To evaluate the effectiveness of our algorithm, we implemented it using the Python programming language and applied it to the PIMA Indians dataset. We then compared its performance with other machine learning algorithms commonly used in similar contexts, such as Naïve Bayes, Decision Tree, Ada Boost, and KNN algorithms implemented under the same environment. We conducted tests on these algorithms, as well as our proposed algorithm, using different splitting ratios (40:60, 70:30) and various values of k. Our results consistently demonstrate that our algorithm achieves higher accuracy than the other algorithms in most cases.
A. Splitting size is 40:60
The best results obtained in PNN are for k=17, Table 2, showing the performance of the studied accuracy in terms of accuracy and precision.
From Table 2, our proposed algorithm PNN outperforms the other algorithm in terms of accuracy and precision. For k=17, KNN outperforms our algorithm in terms of precision. And we compare the results of our algorithm with those for KNN for different values of k, Table 3. A, shows the results for k=9, and Table 3. B, shows the results for k=5.
According to the data in Table 3, the results indicate that PNN has a higher accuracy than KNN. However, KNN has a higher precision than PNN. Considering that precision only evaluates positive cases and may not accurately assess negative cases, based on these findings, we may infer that our method outperforms others by utilizing the average of averages to determine the optimal distance between instances.
B. Splitting ratio 30:70
In all previously examined algorithms, we attempt to modify the splitting ratio to 70% for training and 30% for testing. This involves expanding the size of the training set to determine if improved results can be achieved. Table 4 presents a comparison of the accuracy and precision of all the previous algorithms.
Based on the data presented in Table 4, it is evident that our algorithm PNN surpasses all other results in terms of weighted average for accuracy and precision. Additionally, it demonstrates superior accuracy compared to other algorithms when implemented in the same environment and applied to the same data.
Table 5 presents a comparison between PNN and KNN for various values of k in terms of accuracy and precision. The table also includes the weighted average for both metrics.
| k=17 | PNN | Ad boost | Decision tree | Naïve Bayes | KNN |
|---|---|---|---|---|---|
| Accuracy | 83% | 72% | 68% | 66% | 76% |
| Precision | 80% | 57% | 68% | 65% | 88% |
| - | A | B | ||
|---|---|---|---|---|
| k=9 split ratio 40:60 | k=5 split ratio 40:60 | |||
| PNN | KNN | PNN | KNN | |
| Accuracy | 82% | 76% | 81% | 74% |
| Precision | 76% | 86% | 73% | 89% |
| K=17 | PNN | Ad boost | Decision tree | Naïve Bayes | KNN |
|---|---|---|---|---|---|
| Accuracy | 82% | 69.14 | 64% | 66% | 77% |
| Accuracy weighted average | 76% | - | 54% | 57% | 72% |
| Precision | 81% | 43.9 | 64% | 65% | 83% |
| Precision weighted average | 76% | - | 54% | 57% | 72% |
| - | A | B | ||
|---|---|---|---|---|
| K=9 split ratio 30:70 | K=5 split ratio 30:70 | |||
| PNN | KNN | PNN | KNN | |
| Accuracy | 80% | 78% | 82% | 77% |
| Accuracy weighted average | 73% | 73% | 76% | 72% |
| Precision | 78% | 84% | 81% | 83% |
| Precision weighted average | 72% | 74% | 76% | 72% |
| Machine learning algorithms | Results obtained [5] | Our results | Results Accuracy [20] | |||
|---|---|---|---|---|---|---|
| Accuracy | Precision | Accuracy | Precision | |||
| Decision Tree | 74.24% | 73.9% | 68% | 66% | DT 94% [22] |
J48 73.82% [31] |
| Naïve Bayes | 78.28% | 78.7% | 66% | 65% | 77% [21] |
91% [22] |
| KNN | 79.42% | 80.4% | 76% | 88% | 53.39% [32] |
- |
| Ada Boost | 79.42% | 79.2% | 72% | 57.6% | - | - |
| PNN | - | - | 83% | 80% | - | - |
4. DISCUSSION
By comparing the findings reported in Tables 3 and 5, it can be inferred that the accuracy of PNN has seen a minor decline, while the precision ratios have shown an increase. When it comes to KNN, enlarging the training size has resulted in higher accuracy and precision ratios. However, when considering the weighted average for accuracy or precision, it can be inferred that PNN surpasses KNN across various k values, or that PNN yields comparable outcomes to KNN.
We conducted a comprehensive analysis of our findings, comparing them to the existing literature that has utilized the same dataset, for the same goal, and with the same techniques. In the study conducted by Iqbal, we employed the identical dataset, PID (PIMA Indian Diabetes), to evaluate a collection of machine learning algorithms [5]. Table 5 presents a juxtaposition of our findings with the findings reported in reference [5]. Furthermore, Table 6 presents a comprehensive comparison of the accuracy of several other studies, including both past findings and our own results based on a survey about similar work to our work.
Table 6 clearly demonstrates that our algorithm PNN achieves the highest accuracy results compared to other works when applied to the same dataset. This is attributed to the utilization of the average of average technique in our work, which enhances accuracy.
CONCLUSION
This research presents a novel classification algorithm that utilizes the Hussein search algorithm [3] to perform calculations on data gathered from diabetic and non-diabetic patients. The primary objective of our work was to facilitate predictions by utilizing the majority of the k nearest classified data. Here, k is an integer that represents a set of values closest to the value obtained from unclassified data after performing various calculations, such as averaging and calculating Euclidean distance. In order to evaluate the accuracy of our algorithm, we implemented it in Python and conducted a comparison with other machine learning algorithms, including Naïve Bayes, Decision Tree, Ada Boost, and KNN. We varied the value of k, specifically using values of 3, 5, 9, and 17, and also adjusted the splitting ratio to either 40:60 or 30:70. The results of our study demonstrate that our method surpasses the evaluated algorithms in terms of accuracy. Specifically, we achieved the highest accuracy rate of 83% for a splitting ratio of 40:60 and k=17. In comparison, the knn algorithm under the identical conditions yielded an accuracy rate of approximately 76%. Furthermore, we conducted a comparative analysis of our results with other studies that utilized the same dataset and focused on the same context. In the majority of cases, our method outperformed the other works, as indicated in Table 6. Our future work involves applying our algorithm to various datasets in diverse contexts to determine if the accuracy of our approach improves.
LIST OF ABBREVIATIONS
| PID | PIMA Indian Diabetes |
| NBC | Naïve Bayes Classifier |
| SVM | Support Vector Machines |
| KNN | k-Nearest Neighbors |
| LR | Logistic Regression |
| FPG | Fasting Plasma Glucose |
AVAILABILITY OF DATA AND MATERIALS
The data and supportive information are available within the article.
FUNDING
Financial support was provided by Jadara University Faculty of Sciences and Information Technology.
ACKNOWLEDGEMENTS
Declared none.